World Shock Lab
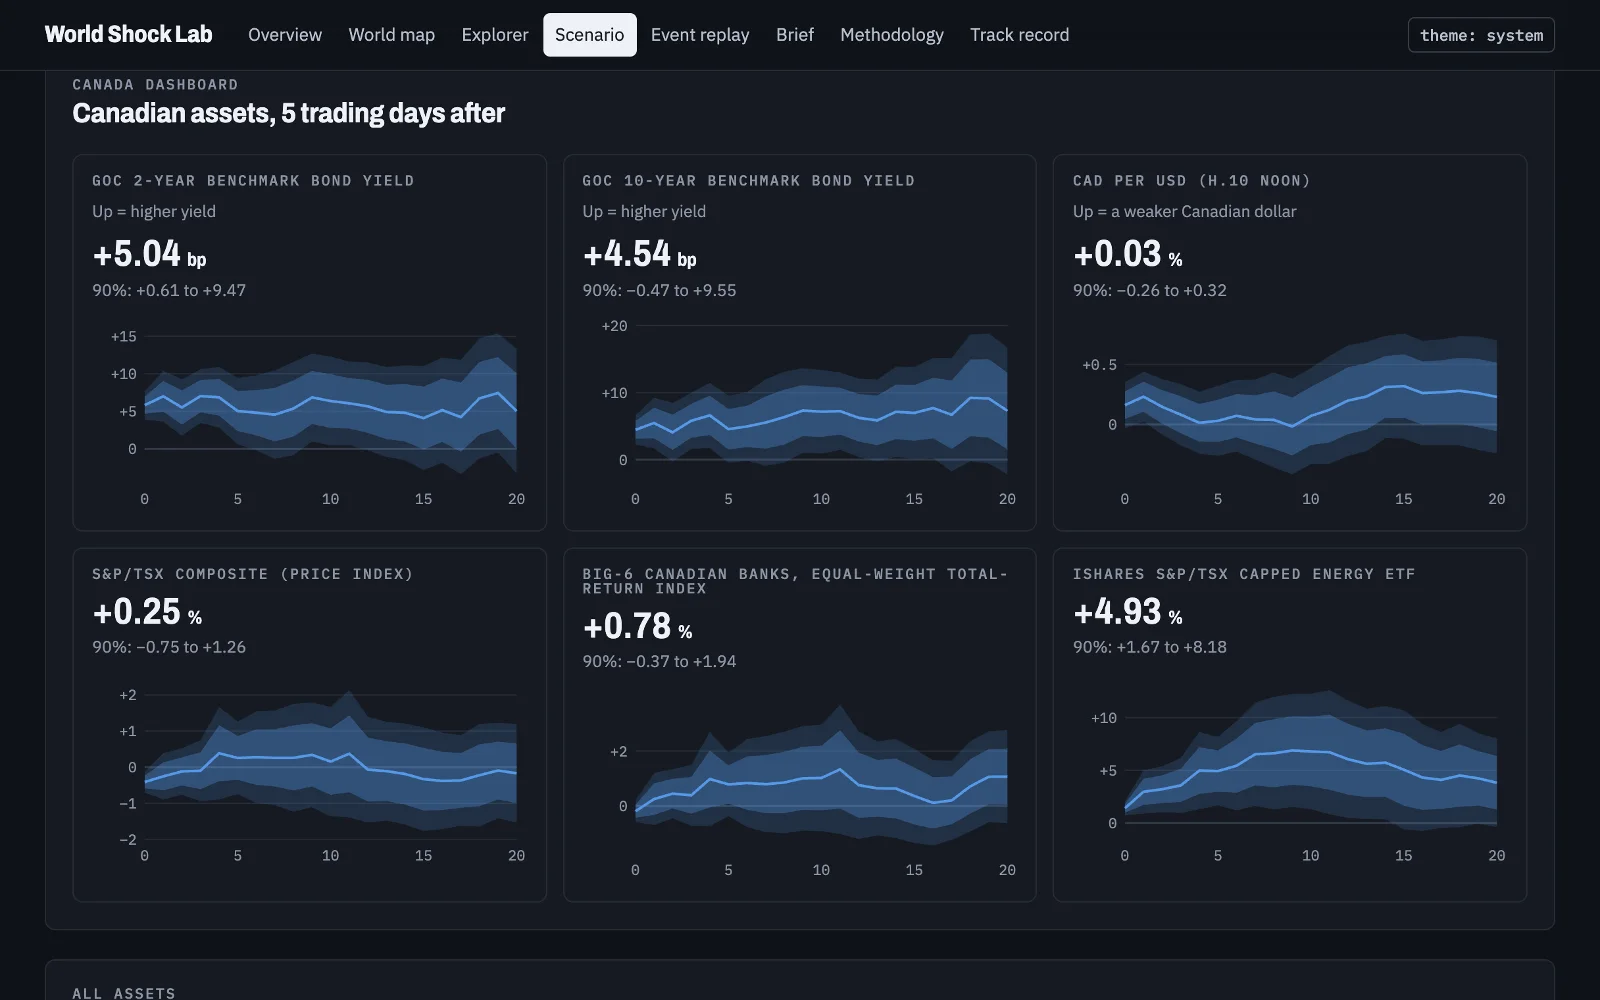
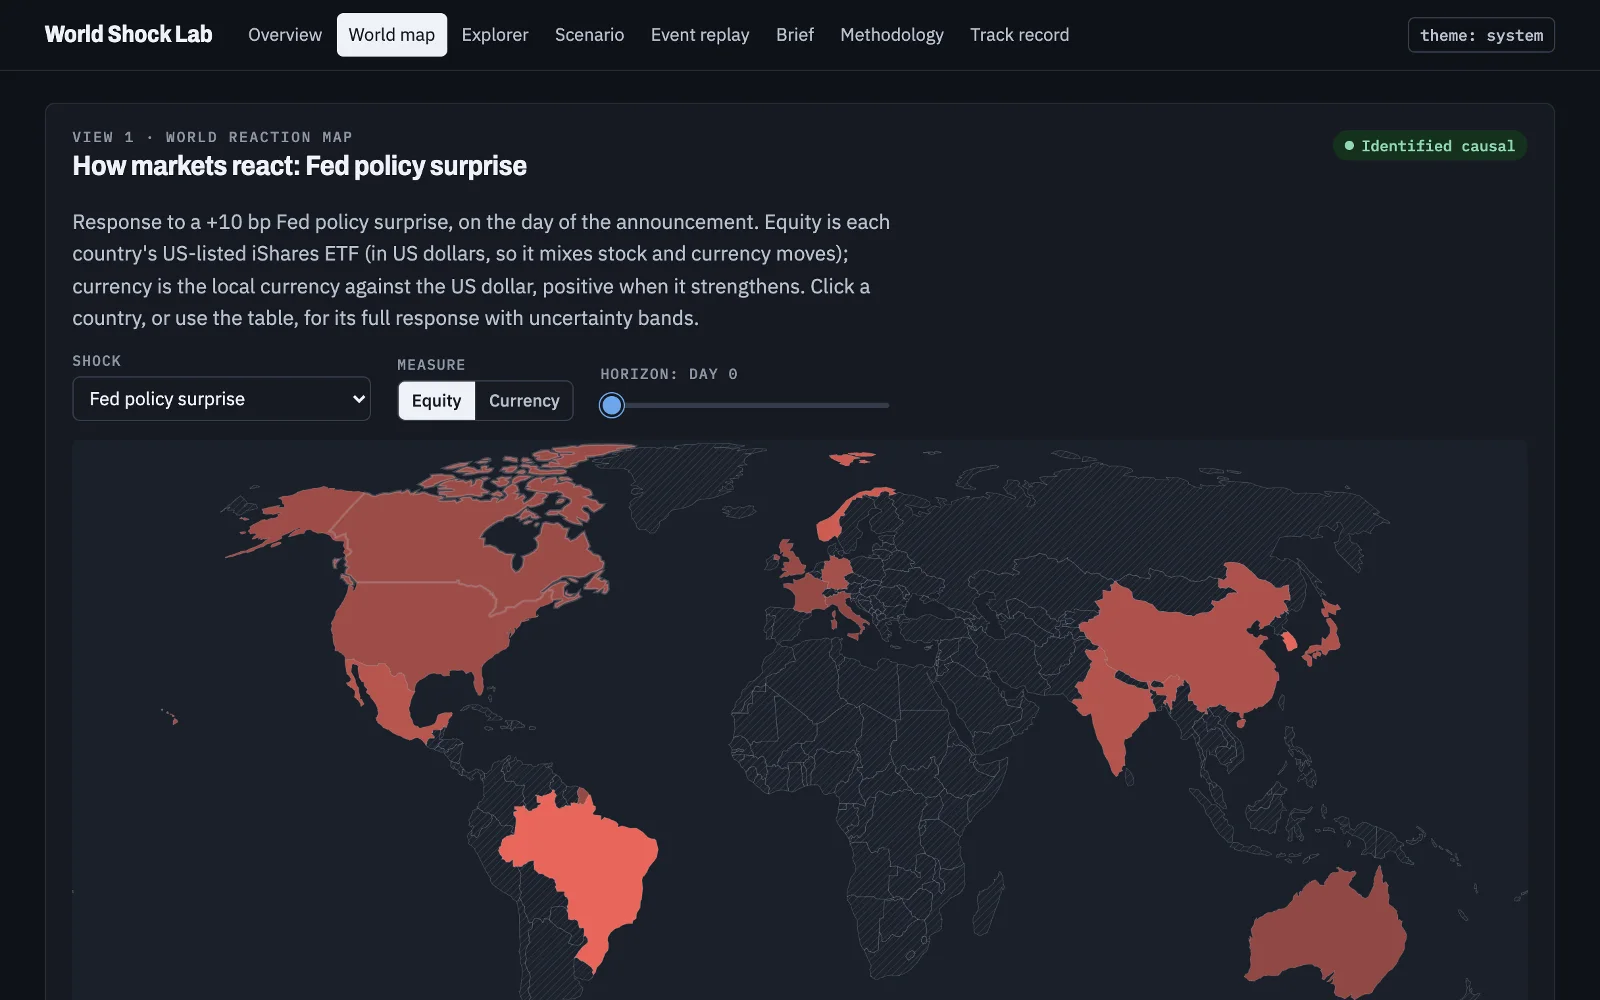
How do the world's markets, and Canada's in particular, react when the Federal Reserve (Fed) or the Bank of Canada (BoC) surprises them?
An open-source research platform that measures how identified shocks move 53 global assets, checks its estimators by simulation and by replicating published papers, tests in advance whether machine learning (ML) adds anything, and serves the results as a scenario tool with forecasts committed before each central-bank decision.
Problem
Markets move for many reasons at once, so a simple correlation between a central-bank decision and a stock index says little about cause and effect. The project measures the causal response of world and Canadian markets to monetary policy surprises from the Fed and the BoC and to oil supply news from the Organization of the Petroleum Exporting Countries (OPEC). It also measures the reduced-form link with geopolitical and trade-policy risk, asks whether the same shock matters more in some economic regimes, and tests whether machine learning forecasts announcement-day moves better than a linear model.
Every output is labelled as one of four kinds of evidence: identified causal, reduced form, model forecast or hypothetical scenario.
Data and identification
- Fed surprises: the change in interest-rate futures in a 30-minute window around each Federal Open Market Committee (FOMC) announcement since 1990, split into a policy surprise and an information surprise (Jarociński and Karadi, 2020).
- BoC surprises: no free intraday Canadian data exist, so I built a list of 195 scheduled decisions from the BoC's own press releases and used the announcement-day change in the 2-year Government of Canada yield as a proxy. Before using it, I validated it: its variance on announcement days is 2.82 times that on matched control days (90% confidence interval 1.99 to 4.00), and 5.71 times after removing the same-day US move.
- Oil and risk: oil supply news from OPEC announcements (Känzig, 2021); geopolitical risk and trade-policy uncertainty indices, labelled reduced form because they measure news coverage rather than exogenous shocks.
- Markets: yields and exchange rates from Federal Reserve Economic Data (FRED), Canadian yields from the BoC, prices for Canadian banks and country exchange-traded funds (ETFs). Every download is stored once, read-only, with its Secure Hash Algorithm (SHA-256) fingerprint pinned, so a revised source can never silently change a result.
- Timing: each series is measured at its own observation time, so a 14:00 statement shows up in noon-fixed exchange rates one day later than in 16:00 stock closes.
Method
- Event-study local projections (LP): for each horizon from 0 to 20 trading days, the cumulative move from just before an announcement is regressed on its surprise, with heteroskedasticity-consistent standard errors. In simulation, its 90% bands contain the true response 90% of the time; a zero-filled time-series alternative manages only 86%, so it is used only as a robustness check.
- Monthly macro effects: local projections with instrumental variables (LP-IV), reported with the effective first-stage F statistic and Anderson–Rubin sets, which stay valid when instruments are weak, next to a proxy Bayesian vector autoregression (BVAR).
- State dependence: a stacked regression interacts each surprise with a regime measured beforehand (high volatility, the policy cycle, inflation above 3%), with wild cluster bootstrap p-values and Benjamini–Hochberg false discovery rate (FDR) control over all 80 tests.
- Pre-registration: time splits, metrics, the regime tests, the robustness rule and the rule for whether ML "adds value" were committed and tagged in git before any model was fitted. The held-out test set was scored once.
Results
Canadian stocks react more to the Fed than to the BoC. Each surprise is scaled to lift its own country's 2-year yield by 10 basis points. A second BoC estimator (Rigobon–Sack), which does not assume the proxy is pure BoC news, narrows the gap: the size of the Fed's lead depends on the method, its direction does not.
| Canadian asset | Fed surprise | BoC surprise | BoC, Rigobon–Sack |
|---|---|---|---|
| S&P/TSX Composite (%) | −1.10 [−1.59, −0.61] | −0.19 [−0.33, −0.04] | −0.75 [−1.42, −0.37] |
| Big-Six Canadian banks (%) | −0.76 [−1.32, −0.19] | 0.00 [−0.16, +0.15] | −0.63 [−1.36, −0.20] |
| 10-year Government of Canada yield (basis points) | +4.40 [+2.99, +5.81] | +4.64 [+3.75, +5.52] | +2.47 [+0.67, +3.75] |
| Canadian dollars per US dollar (%) | +0.40 [+0.23, +0.57] | −0.37 [−0.53, −0.21] | −0.49 [−0.85, −0.24] |
- Credibility: 11 of 13 published findings replicate. When the real surprises are moved to 1,000 sets of random non-announcement days, no placebo draw is as large as the real Fed effects on the US 2-year yield and US stocks. 24 of 30 headline responses keep their sign in every pre-registered robustness variant and stay significant in at least two thirds of them.
- Spillovers: 126 of 318 shock-to-asset responses survive false-discovery control, led by hawkish Fed surprises lowering equity prices around the world.
- Regimes: 15 of 80 regime tests have p ≤ 0.10 before correction, against about 8 expected by chance, and none survives. The sample can only detect large regime differences, and the minimum detectable effect is reported for every test.
Does machine learning help?
Six models predict the 1-day and 5-day move of eight assets after each FOMC, BoC and OPEC announcement, using only the announcement's own surprise and the state of the economy before it, refit every year on earlier data. The validation years chose the linear projection and the neural network as the two candidates; the test set from 2019 to 2026 was then scored once.
| Model | Error |
|---|---|
| Neural network (multilayer perceptron) | 1.139 |
| Linear local projection | 1.142 |
| Gradient boosting | 1.147 |
| Ridge regression | 1.160 |
| Predict no move | 1.195 |
| State-dependent local projection | 1.212 |
The neural network's error minus the linear model's is −0.003, with a 90% interval of −0.019 to +0.014 that includes zero. By the rule fixed in advance, the verdict is no evidence that ML adds value. Permutation importance shows the ML models rely almost entirely on the surprise itself.
What didn't work
- Machine learning did not beat the linear model, and no regime effect survived correction.
- The BoC proxy passed validation but still carries some common North American rate news, so every BoC result is shown next to the Rigobon–Sack estimate.
- Monthly macro effects rest on weak instruments (first-stage F of 3.1), so they are labelled suggestive.
- The proxy BVAR's bootstrap bands are too narrow in simulation; I documented this rather than tuning it away.
Live forecasts
Before each Fed and BoC decision, a conditional forecast is committed to the public repository: if the announcement moves the bank's own 2-year yield by −10, 0 or +10 basis points, here is the expected move in the Canadian 2-year yield, the Canadian dollar and Canadian banks, with 68% and 90% ranges. Forecasts are never edited, and each is scored against what happened once the outcomes are published. The first forecasts, for the decisions of 2026-10-28, were published on 2026-10-13.
Engineering
- The whole pipeline reruns from the pinned downloads with one command; a full rerun took 11 minutes and reproduced every result.
- 145 automated Python tests, including Monte Carlo recovery of known responses, run in continuous integration (CI) on every push.
- The strategist brief and the research note are generated from the results by templates, and tests fail if either contains a number that is not in the data.
- The static site loads every view in under 3 seconds on a throttled phone profile, and an automated accessibility check finds no violations.
Python 3.12 · pandas · NumPy · SciPy · statsmodels · scikit-learn · PyTorch · DuckDB · Parquet · pandera · Typer · pytest · Hypothesis · ruff · mypy · uv · React · TypeScript · Vite · D3.js · Vitest · axe-core · GitHub Actions · GitHub Pages